Disclaimer: The contents of this post, including all opinions and analyses, are based solely on publicly available information. The views expressed herein are my own and do not reflect those of any organisation or entity with which I am affiliated.
Motivations Link to heading
On the 24th of November, Finnish day-ahead energy prices closed at -€500 per MWh (-€0.50 / kWh)1. In Finland, unlike the UK, variable tariffs are commonplace2, meaning residential consumers earned approximately 30€ for charging a standard EV (64MWh). This occurred due to an erroneous bid by Kinect Energy, who sold on average 5887 MWh of energy for every hour of the 24th at any price. This would have been okay, had it not been for the fact that the energy did not exist. This bid resulted in a ghostly oversupply, causing the market price to plummet.
These events, alongside some discussion at work, motivated me to create a post on how and why we see negative electricity prices.
Definitions Link to heading
Day-ahead markets are where the vast majority of electricity is bought and sold 24 hours in advance by plant owners, energy suppliers, etc. This system is responsible for balancing the bulk of energy demand and supply, which provides stability to the market.
Whilst stakeholders are good at predicting how much demand and supply they need a day in advance, in cases where they cannot meet day-ahead commitments, they can trade on intraday markets. In the case of Kinect Energy, they would purchase back the 5GW of energy to meet their sell order via the intraday markets.
To understand negative prices, we only need to know about day-ahead markets. I will stick to examples within the EU markets.
How Day-Ahead Markets Work Link to heading
The day-ahead market is broken up into hourly chunks, where buy and sell orders will be offered for each hour. Each hour will have its own clearing price. Day-ahead markets are auctions, so much of this will be familiar to you.
In a simplified example, let’s say it’s is 1 PM; we have just recieved buy and sell orders for 12 PM - 1 PM on the following day and now want to calculate the market clearing price for that slot, tomorrow. Let’s take a look at three orders to see what we are dealing with:
| Order Type | Energy (MWh) | Price (€/MWh) |
|---|---|---|
| Buy | 5 | 75 |
| Buy | 5 | 75 |
| Sell | 10 | 60 |
There are two orders to buy 5MW at €75/MWh and one order to sell 10MW at €60/MWh.
In order to determine the market-clearing price, we will apply basic market principles to the buy and sell orders, similar to an auction. Buyers willing to pay the highest prices and sellers offering the lowest prices will get priority. To see who wins and who loses, we will construct something called aggregate-bid curves for both the buy and sell orders. Here is how we do it:
- ‘Aggregate’ the bids, meaning we combine orders of the same price and type, in the above case we will combine the two 5MW buy orders in to a single 10MW order.
- Sort the buy orders (demand) from highest to lowest.
- Sort the sell orders (supply) from lowest to highest.
- Once we have sorted the buy and sell orders we keep track of the total energy at each point in the list. We call this the cumalative (cum.) energy.
Ok, let’s see the full list of buy and sell orders, adding the cumalative energy.
| Order | Energy (MWh) | Price (€/MWh) | Cum. Energy (MWh) |
|---|---|---|---|
| Buy | 5 | 80 | 5 |
| Buy | 10 | 75 | 15 |
| Buy | 15 | 70 | 30 |
| Buy | 20 | 65 | 50 |
| Buy | 25 | 60 | 75 |
How do we interpret this data? Well, between 0 - 5 MW the highest offer the market has is €80/MWh, and then from 5 - 15 MWh the highest the market can offer is €75/MWh and so on. The people below this threshold are priced out and the people above are still happy because they were always willing to pay more
Let’s do the same for sell orders, except in reverse.
| Order | Energy (MWh) | Price (€/MWh) | Cum. Energy (MWh) |
|---|---|---|---|
| Sell | 5 | 55 | 5 |
| Sell | 10 | 60 | 15 |
| Sell | 15 | 65 | 30 |
| Sell | 20 | 70 | 50 |
| Sell | 25 | 75 | 75 |
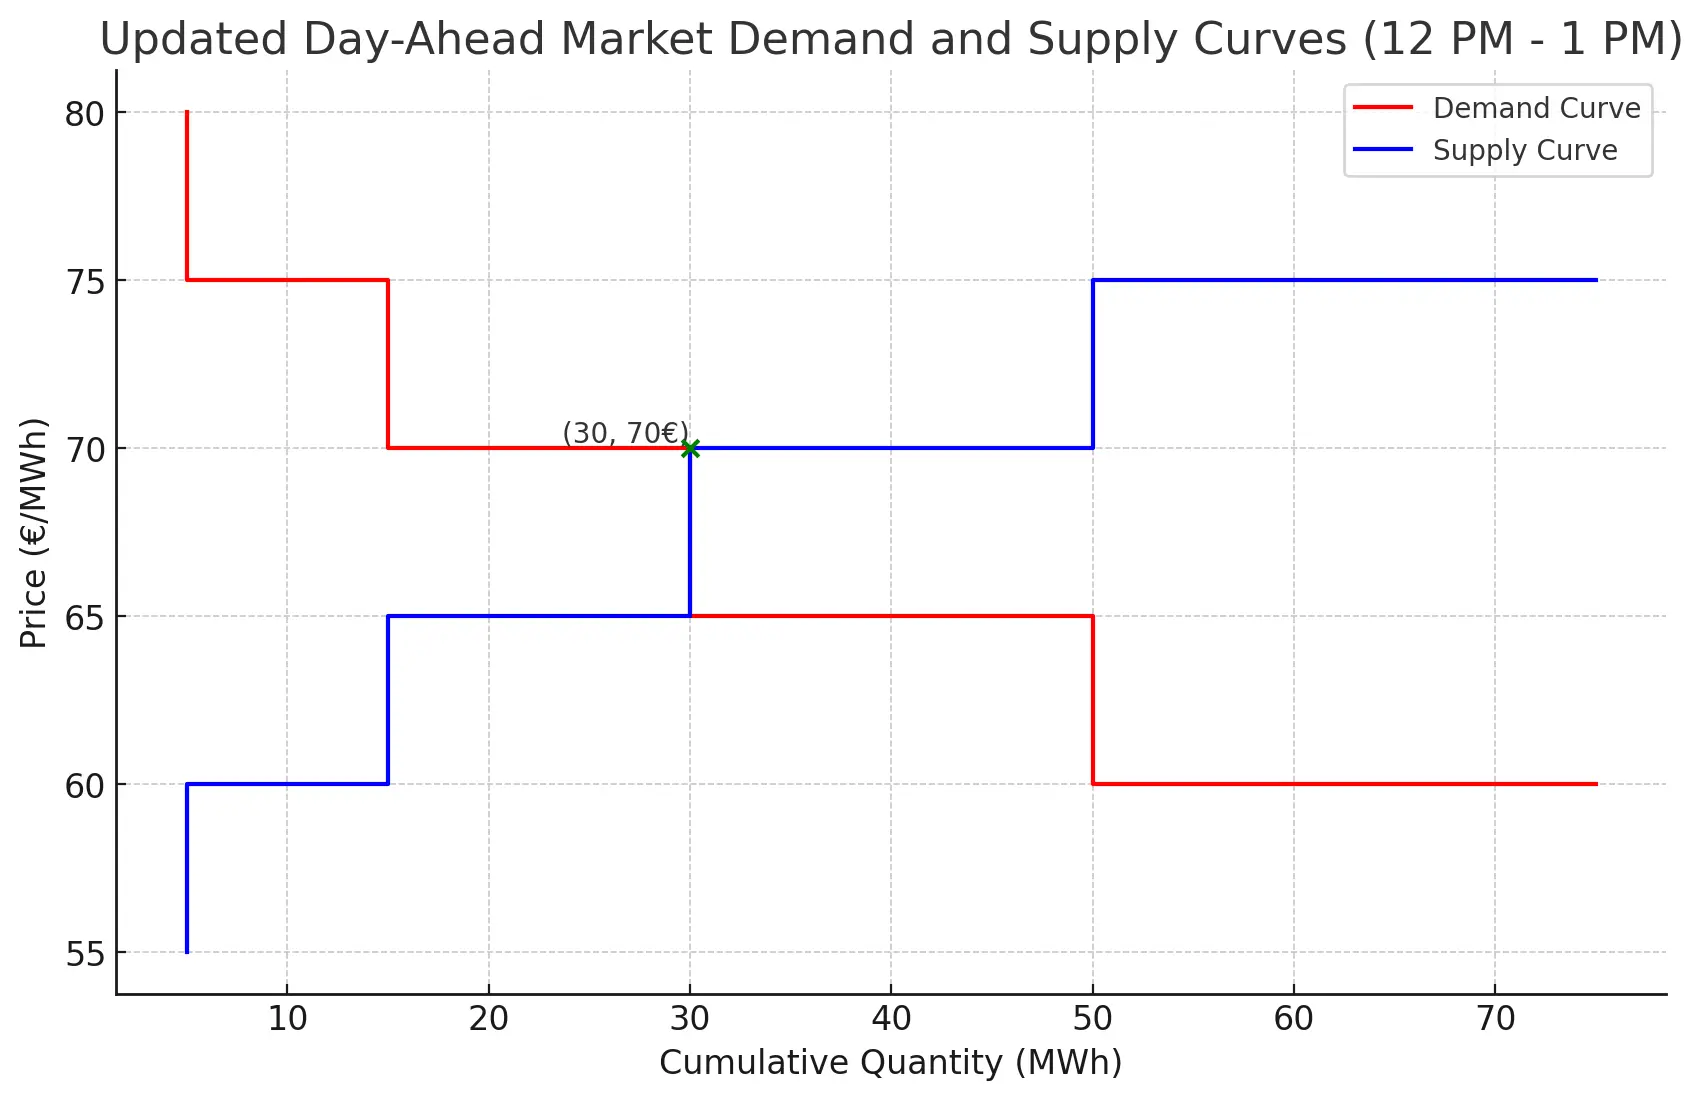
To create stepwise aggregate-bid curves, we plot price against energy for both demand and supply, and voilà!

The clearing price will be where the curves intersect. In this case, it is €70/MWh. All buy orders above or equal to this price will be accepted, and all sell orders below this price will be accepted. All market participants will pay the clearing price, even if you bid higher or sell lower. For readers familiar with economic principles, you will recognise that these are demand and supply curves.
There you go, it is as simple as that! Now we know that the for the following day between 12 - 1PM, the amount of energy to be traded will be 30MWh at €70/MWh.
Real Market Data & How We Hit Negative Prices Link to heading
Ok, great, now that we know how day-ahead markets clear, let’s look at some real data. In the EU area, most trades are handled and executed by NEMOs (Nominated European System Operators). Most do not have publicly available data to view orders (only graphs). Fortunately, some NEMOs do provide publicly accessible data.
Greece Link to heading
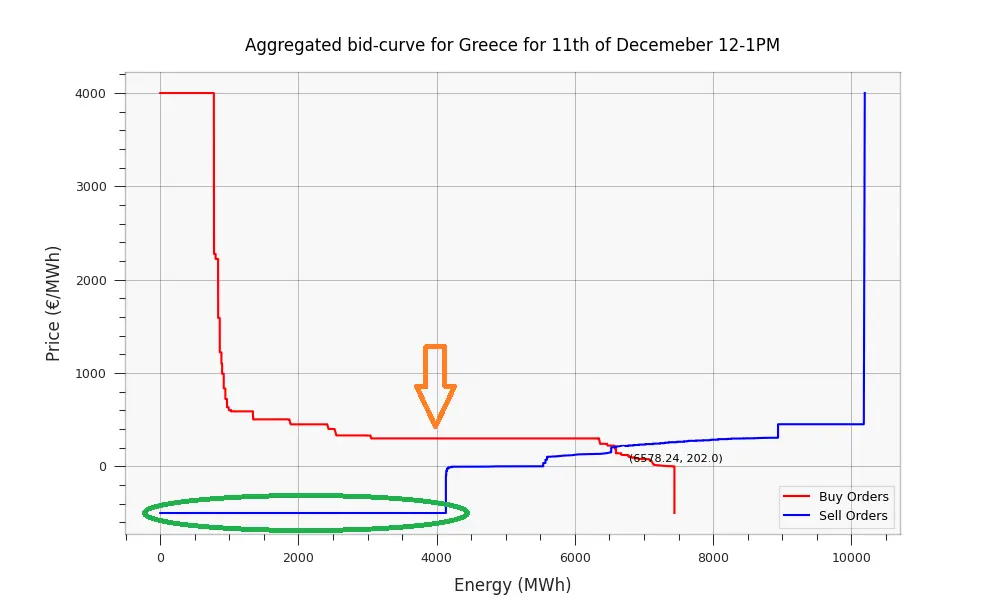
I am picking Greece, since their NEMO, HEnEx, provide free day-ahead market data in CSV format, which I can plot into my own visualisation. Let’s take a look at the aggregate-bid curve for tomorrow (11th of December 2023) at 12 PM in Greece.

Nice, this should now be familiar to you! By looking at the intersection of supply and demand we can see that the market cleared at €202/MWh with users requesting 6578 MWh of energy, great! Let’s breakdown the graph to highlight aspects of it which could draw about negative prices.
- As outlined by the green circle, sell orders show that 4.2 GWh of energy is being sold at the minimum cap of -€500/MWh – meaning any price.
- If there was a 35% reduction in demand, from 6578 MWh, the the market clearing price would have been negative, as indicated by the orange arrow.
- If you use your imagination, you can see the Finland case where the area outlined by the green circle extends (+5GWh) and shoots past the red line, meaning the prices cap at -€500/MWh.
Negative prices occur when there is an oversupply or underdemand of energy. As noted in (1), there is a significant amount of energy being sold at the floor price. You may be wondering, who would pay to sell their energy? And, how can that be possibly be econmically feasible? Here are the assets types that can achieve this:
- Renewables: Curtailing certain renewables like solar and wind can be expensive. Often, renewable farm owners receive fixed non-market prices3 based on their contracts, designed to foster development. This setup means they’re not influenced by market prices. Additionally, some member states subsidise green feed-in4 to the network, making negative prices remain profitable.
- Inflexible assets: These include assets like nuclear plants, which can cost more to curtail (in a day-ahead timeframe) than the expense of selling at a loss.
Due to inflexible generation, even minor shifts in demand, as highlighted in (2), can lead to negative prices. This trend is common in EU countries with significant renewable or nuclear energy generation. I refer to this as a tight market condition, where minor fluctuations in demand or supply, can result in unusual prices . This works both ways, overdemand and undersupply of energy will cause prices to skyrocket. Price caps are hit when the aggregate-bid curves no-longer intersect, Nordpool provides a comprehensive explanation of this phenomenon, and how they deal with it.
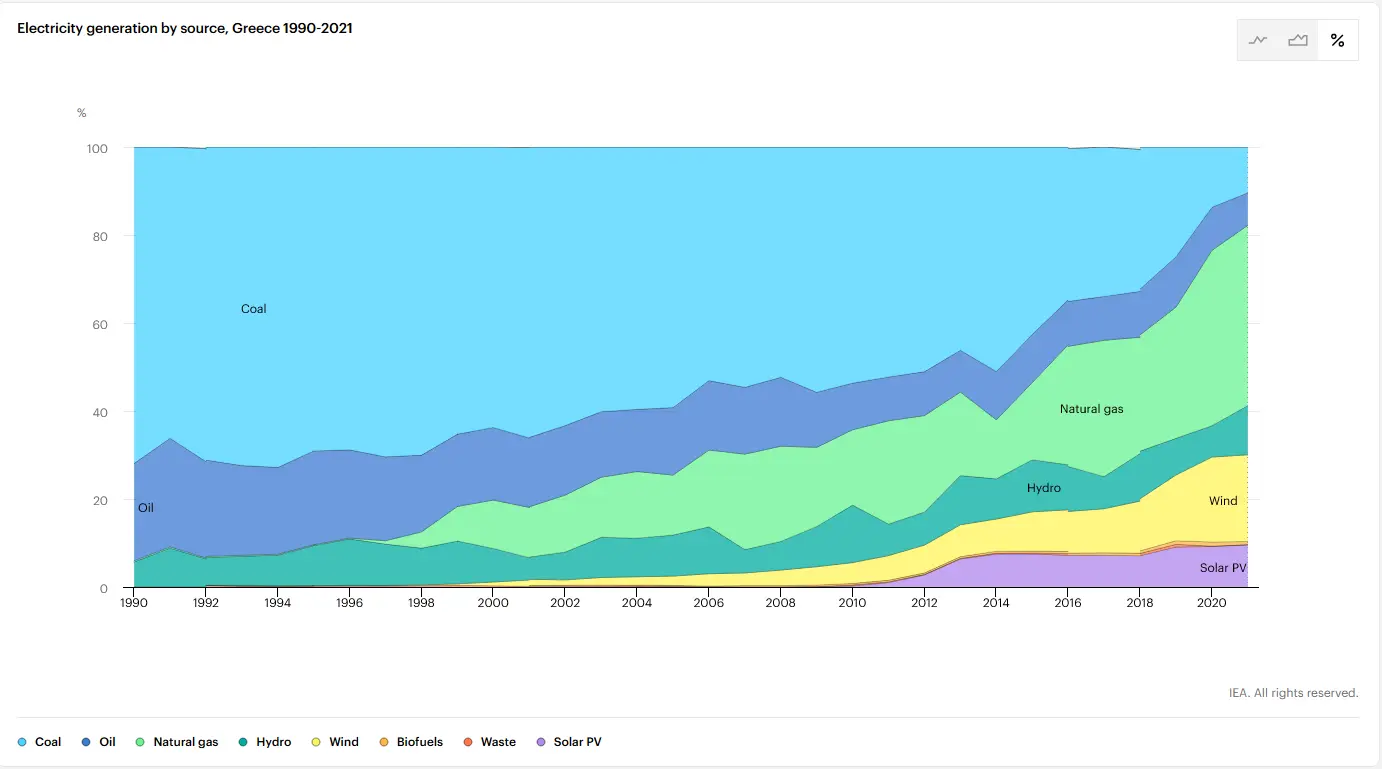
To bolster our suppositions here is a look at the sources of electricity generation in Greece.

Greece has a lot of wind and solar generation, amounting to over 30%! This is quite high, as you will soon see when we compare it to other EU countries.
Poland Link to heading
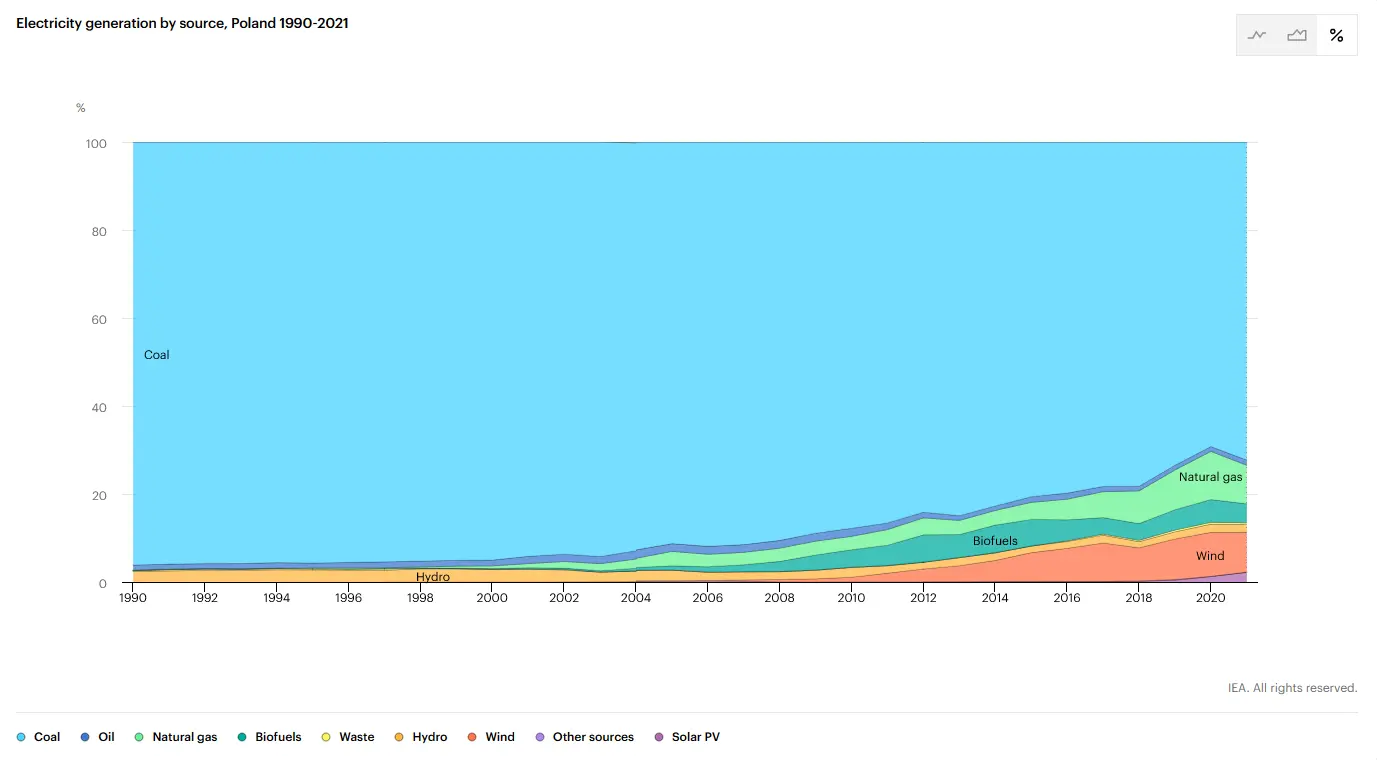
In contrast to countries with signficant wind, solar or nuclear energy, Poland presents an interesting case in the day-ahead electricity market. The country’s energy mix is heavily dependent on coal, contributing about 70% to its electricity generation, with less than 10% coming from renewable sources, see chart below.

Poland’s market is heavily reliant on coal. Source: https://www.iea.org/countries/poland
Lets see Poland’s aggregate-bid curves for December 11, 2023, at 12 PM. Sticking to the same date does not have much significance as a control variable, since these markets are extremely complicated. We are using the same date and time for no better reason than ‘why not?’.

Market cleared at €132.71 / MWh & 873.70 MWh. Source: https://tge.pl/
The sell offers are markedly more flexible than in Greece. Less than 90MWh of energy is being sold at the market floor price. That means that the inflexible supply percentage – total MWh offered at minimum price cap / Settled MWh – is less than 10%! To induce negative prices similar to those seen in some renewable-heavy markets, a dramatic decrease in demand would be necessary – a scenario that is nearly unattainable under polish market conditions. Even a large-scale error, such as the Kinect bid, when adjusted for market size, would not suffice to cause a market crash.
It’s important to note that a relatively smaller percentage of Poland’s market is traded on the Day-Ahead exchange, so there is only so much weight we can put on the inferances. Examining the inflexible supply percentages in other EU countries on December 11th at 12 PM will help paint a better picture:
| Country | Electricity Generation Mix | Inflexible Supply Percentage |
|---|---|---|
| Norway | 95% Hydro (Fig. 1) | 20% (Fig. 2) |
| Belgium | 65% Nuclear, 18% Wind and Solar (Fig. 3) | 82% (Fig. 4) |
| France | 60% Nuclear, 10% Wind and Solar (Fig. 5) | 69% (Fig. 6) |
| Czechia | 40% Coal, 10% Natural Gas (Fig. 7) | 40% (Fig. 8) |
| Nedtherlands | 23% Wind and Solar (Fig. 8) | 68% (Fig. 9) |
All data sourced from IEA (International energy agency) for generation mix and EPEX-SPOT for market information.*
As you can see, Norway and Czechia have a very low inflexible supply percentage, which makes sense since coal, hydro, and gas are highly flexible. Belgium and France have a higher inflexible supply percentage, likely owing to their dependance on renewable and nuclear electricity generation. Nedtherlands, also stands out due to their massive dependance on wind and solar at almost 25%!
As you might predict, of these countries Belgium and Nedtherlands have the highest number of hours where prices are below zero, who would have thunk!
Please note: The purpose of this exercise is to provide a basic understanding and visualisation of the dynamics in electricity markets, especially concerning negative pricing. It’s important to acknowledge that this is a simplified and incomplete explanation. Factors like the strength of flexibility markets, the total percentage of capacity in day-ahead markets, the magnitude of each type of generation, variance of markets (day-to-day), among many others, play a significant role and often covary. This article doesn’t aim to prove any specific point but rather to offer an introductory insight. I am not an expert in electricity trading. My training is in physics and software engineering.
Thoughts Link to heading
I hope this post enhances your understanding of the dynamics behind negative energy prices and the broader electricity market. The key takeaway is how inflexibility in supply or demand can lead to undesirable market prices, a situation often influenced by factors like the types of generation assets, renewable energy policies, and the intensity of demand in densely populated cities. Additionally, the post highlights the challenges associated with integrating solar, wind and nuclear power into the electricity network."
On the Kinect situation Link to heading
Lastly, I would like to discuss the Kinect situation in Finland. This incident was unfortunate, as it significantly damaged the reputation and trust in NordPool (NEMO in Scandanavia) and energy markets in general. It also brought to attention that there is a very real risk of malicious actors causing widespread system damage. Fortunately, in this case, it was a supply side issue, but imagine, if instead, it was a false demand side bid. This could potentially drive consumer prices to their cap at €4000/MWh, causing pandemonium within the public…
I suppose the silver lining is that the intraday markets functioned as intended, bringing balance to the system and stabalising prices. This should hopefully improve confidence in the system.
Anyway, thank you and until next time 👋

Night and Dark